Posting gains in the past, present and future
September marked the fifth consecutive month of gains in the equities market, bringing the performance of the global index up to 3,23%*.
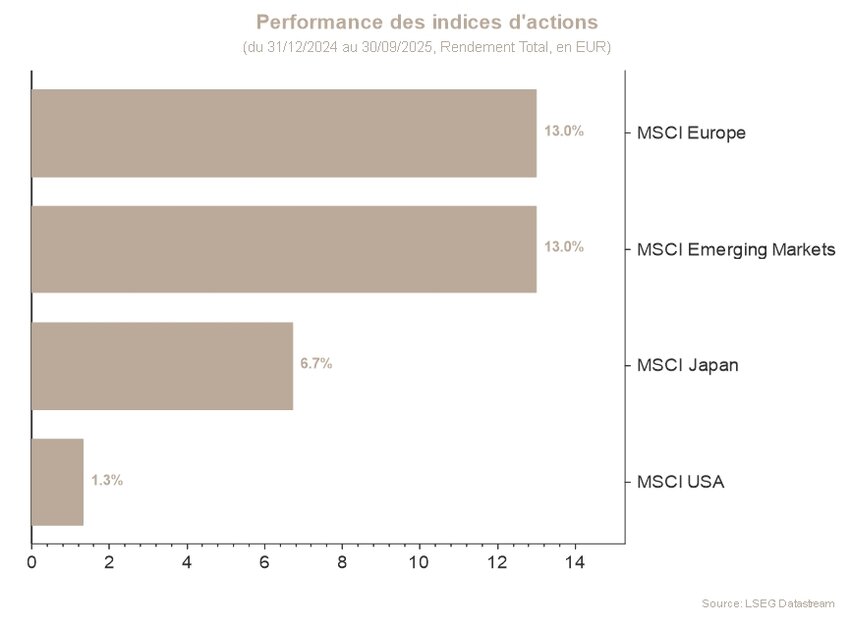
US markets were once again the drivers (+3,24%), as were emerging markets in particular, which rose by 6,67% over the period. Europe posted a decent but more modest gain of 1,5%.
In fixed income, the US 10-year benchmark rate fell from 4,23% to 4,15% – a slight decline that suggests a downwards trend on which the US Federal Reserve (Fed) is expected to take action – while in Europe, the German 10-year rate stabilised at around 2,70%.
In the US, conflicting signals from economic data make it harder than usual to read the cycle. While job creation has been stagnating at its lowest level for several months, the latest growth figures for the second quarter have been revised sharply upwards, notably in consumption. Real growth stood at 3,8% vs. the 3,3% that was initially estimated, while consumption rose by 2,5% vs. the initial estimate of 1,7%.
But although job creation is sluggish, job losses are not on the agenda either. This new balance of slowed momentum in the jobs market has managed to keep the unemployment rate contained.
Moreover, the effects of inflation on the US economy continue to be a source of concern. However, the current rise in inflation mainly attributable to tariffs – which the Fed considers as transitory – is not derailing inflation expectations.
In this context, where employment growth is flailing and inflation is described as temporary, the Fed took the liberty of reducing its key rates by 25 basis points in September, and is envisaging one or two more similar cuts between now and the end of 2025.
Europe’s current economic equilibrium is based on lower levels of growth and inflation. According to its latest forecasts, the European Central Bank (ECB) expects inflation to fall below its 2% target over the next two years, with economic growth struggling to take off above 1%.
In short, investors are pleased to see interest rates falling in the US, as this could prolong the duration of the current economic cycle. Historically, when the Fed cuts its key rates and the US economy avoids recession, equities markets rise in the months that follow.
In view of this general environment, we increased the equity weighting in our portfolios to neutral. From a geographical standpoint, preference is being given to Europe, on the one hand, and to emerging markets, on the other, in the face of a US market that has become considerably more expensive.
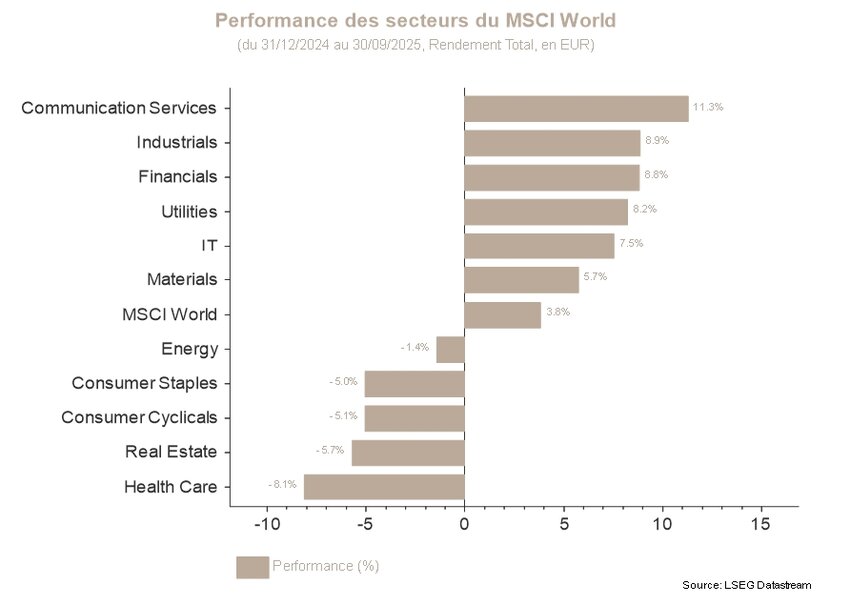
In terms of sectors, Communications Services, Basic Materials, US Banks and Utilities are overweight. The recent overweighting in Utilities offers exposure to the issue of rising electricity demand, driven notably by exponential needs linked to artificial intelligence.
As regards fixed income, US sovereign yields and duration both called for vigilance, while Europe’s more benign inflation enabled duration to be maintained closer to that of the market. Lastly, corporate debt remained neutral thanks to the carry effect and contained spreads.
*Performance is calculated in EUR.
Stock markets
In September, global equity indices were mostly in positive territory, propelled by new macroeconomic and monetary driving forces. Pockets of performance were distributed relatively disparately, while Chinese and emerging indices posted outstanding gains. As such, the MSCI China progressed by 9,23%, followed by the emerging markets index, which posted a gain of 6,67% at the end of the month.
In the US, following an encouraging season of earnings publications, investors are positioning themselves in favour of maintaining momentum as the Fed’s rate cut cycle begins to take effect. The clarification of the monetary policy thus helped to foil statistics linked to a historically unfavourable September season for the markets. From a fundamental point of view, companies continued to report strong investment momentum, which was perceived positively by the market. The Technology and Communications Services sectors thus significantly outperformed the rest of the market.
In Europe, the situation was more mixed: macroeconomic determinants seemed to point to lacklustre growth, while the consensus expects further deterioration risks, which partly explained the 1,6% fall in the MSCI Europe at the end of the period. Sectorial analysis once again showed that the Materials sector, which was supported by higher growth estimates and generally more favourable tariffs, significantly outperformed the others. The Tech sector also rebounded well, while significant capitalisation in the sector clarified some of the cumulative losses.
In a context of high valuations and sometimes contradictory signals, visibility of market trajectories remains limited. To this end, we are maintaining a selective and diversified managerial approach in a potentially tricky market context.
Sovereign yields and credit market
September was dominated by central bank decisions, an avalanche of conflicting economic data and persistent volatility in the long-term segments of sovereign curves, particularly in the US.
On the other side of the Atlantic, the Fed cut its key rate by 25 basis points, bringing the target range to between 4,00% and 4,25%. Jerome Powell described this first downturn of the year as a ‘risk management exercise’, attributing it mainly to a deteriorating labour market rather than to persistently high inflation. However, his tone remained cautious, with no clear commitment to either the timing or the extent of the monetary easing that is still to come. The dot plot still predicts two cuts by the end of 2025. Views of committee members, however, remain largely disparate. Meanwhile, US economic data for September painted a mixed picture: the labour market is weaker, but underlying activity is more resilient than expected. Faced with these contrasting signals, the 10-year yield lost 7 bip and ended the month at 4,15%, while the 30-year yield lost 19 bip and ended at 4,72%. This resulted in a flattened curve, which froze the steepening movement observed in previous months.
In the eurozone, bond markets experienced less abundant movements than in previous months: the 10-year Bund ended the month with a very slight fall of 1 bip (2,72%), while the 2-year rose by 8 bip to 2.01%. With tariff uncertainties fading and the European economy showing signs of resilience, the ECB proved less inclined to cut rates in the future. In the European landscape, however, France stood out and attracted all the attention: after Bayrou’s government suffered a vote of no confidence and Fitch downgraded the country’s sovereign rate from AA- to A+, OATs (French sovereign bonds) underperformed. The OAT-Bund spread remained under pressure, hovering around 80 bip throughout the month.
Meanwhile, credit markets continued their positive trend. In the US, investment grade spreads tightened again to 73 bip, while their European counterparts fell by 7 bip to 77 bip.